by Madrid, published on TradingView in 2014
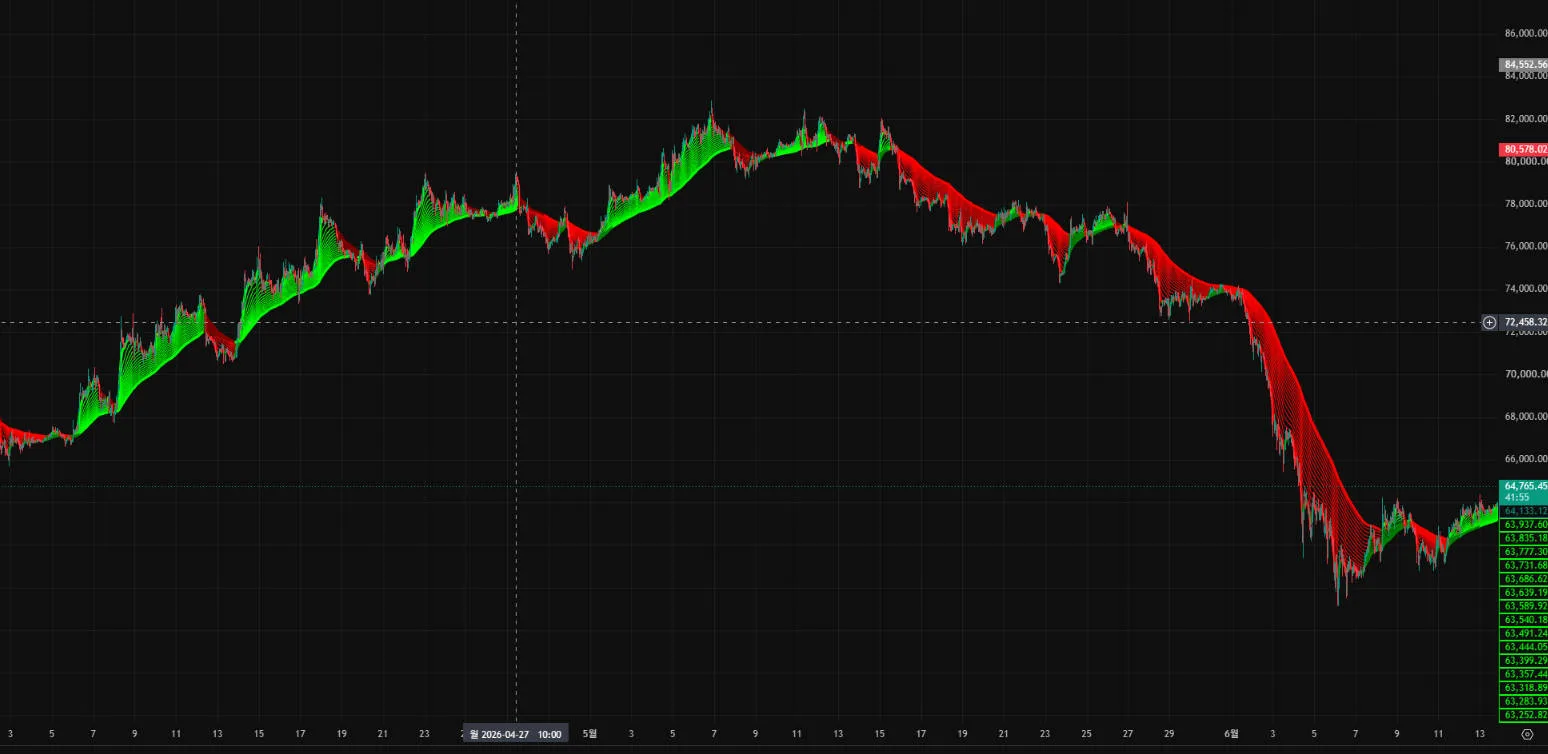
Madrid Moving Average Ribbon is not a TVIEW LAB creation. We ran the creator's public code as-is, analyzed the results across multiple markets, and recorded what we found. No invented reviews, no conventional wisdom. Anything the research couldn't prove is marked "unconfirmed."
Everyone has been there. You enter with conviction — and the market goes against you. You catch a signal and jump in late; that's the top. You stop out, and it rallies. Was it just bad luck? Searching for an answer to that question, we analyzed over 700 of the most popular TradingView indicators, picked the simplest and most intuitive, and narrowed them down to the combination that held up most consistently against volatility across multiple markets and timeframes — then ran the full backtest from start to finish.
You've seen moving averages. A line connecting price averages. One line tells you one thing: above or below. Madrid takes that line and stacks 18 of them — each a different period — into a single ribbon.
Stack 18 and you see what one line hides. When they all align in one direction, the ribbon stretches wide. When they don't, it bunches tight and tangles. Green for up, red for down. This indicator doesn't say "buy now." It shows you "which way the trend is pointing — and how aligned" in a single look.
So the right question isn't "what color is it?" It's "is the trend alive and pointing, or just drifting?"
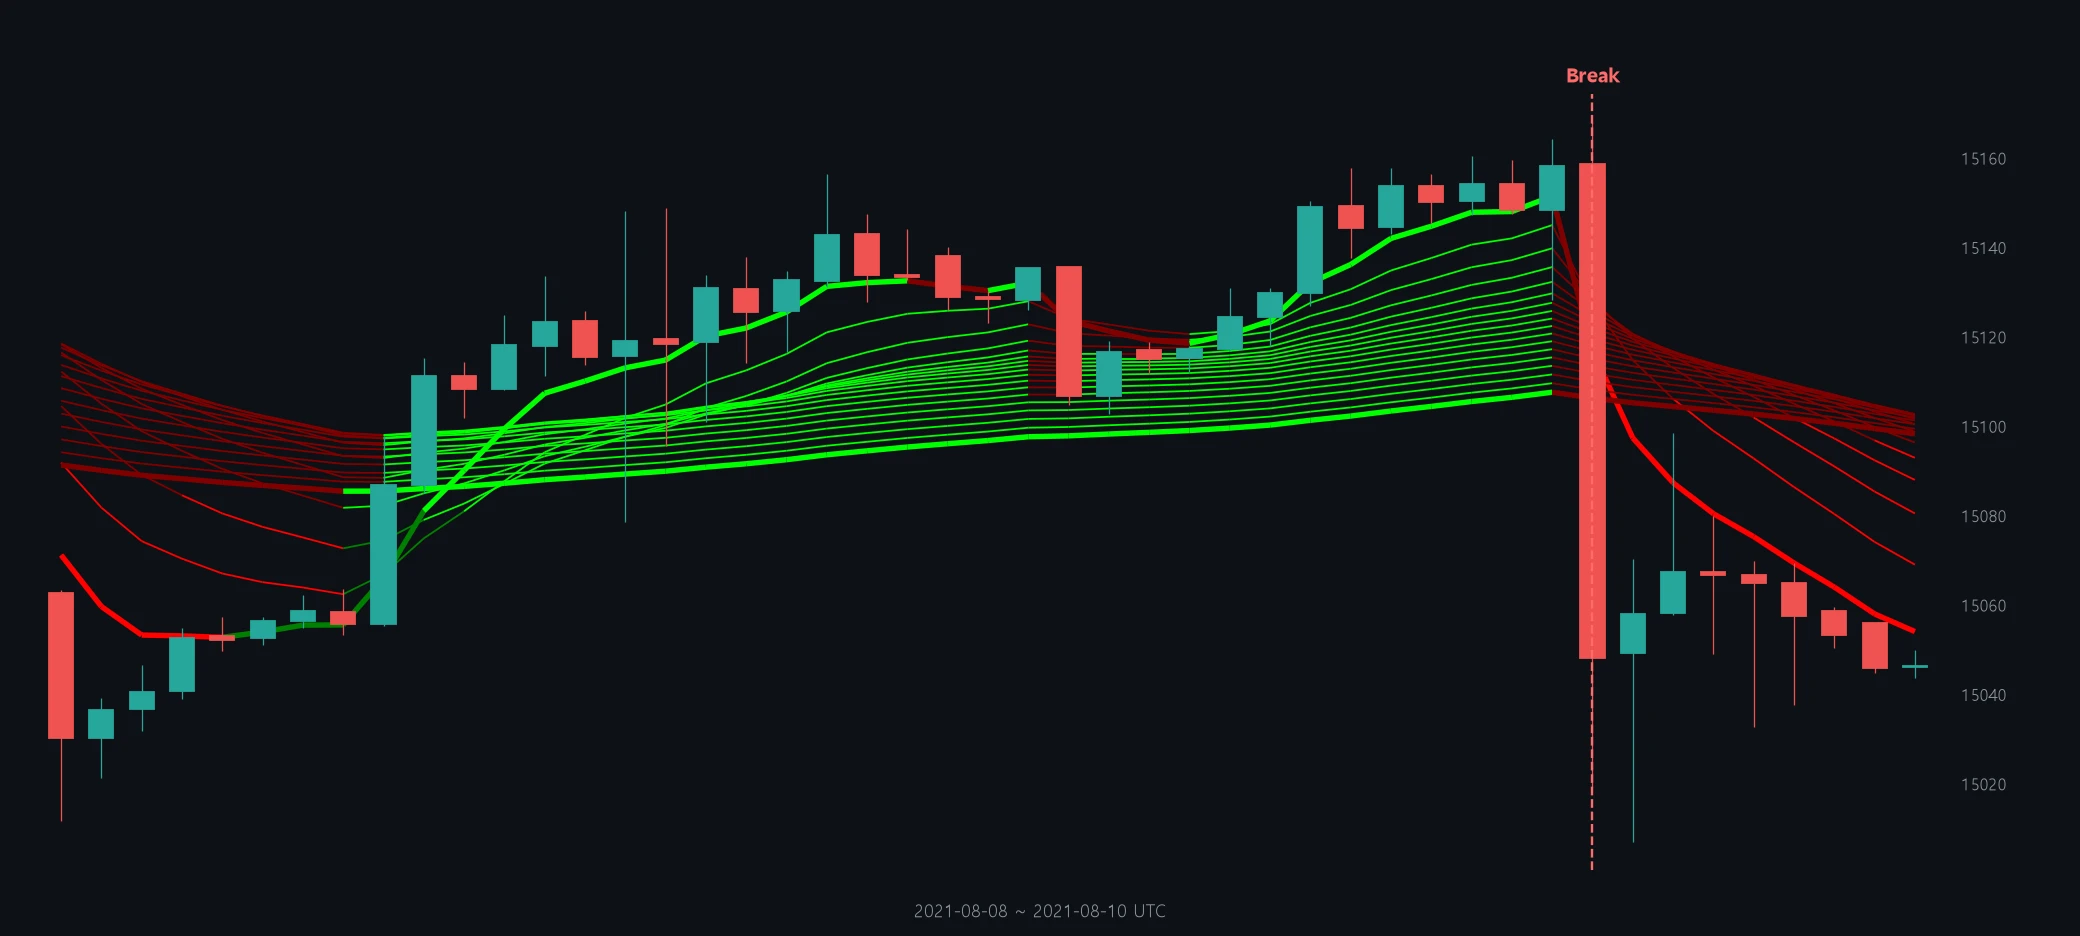
The terms and criteria used throughout are defined below. Come back here if anything gets confusing.
Beyond this indicator, the hundreds of indicators out there each have a different character. This one gave more stable results on 1-hour charts or higher. On 1-minute or 5-minute charts, direction changed too frequently — setting a reliable baseline was nearly impossible. If you're scalping with it anyway, 15 minutes or higher is what I'd suggest. This study used the 1-hour.
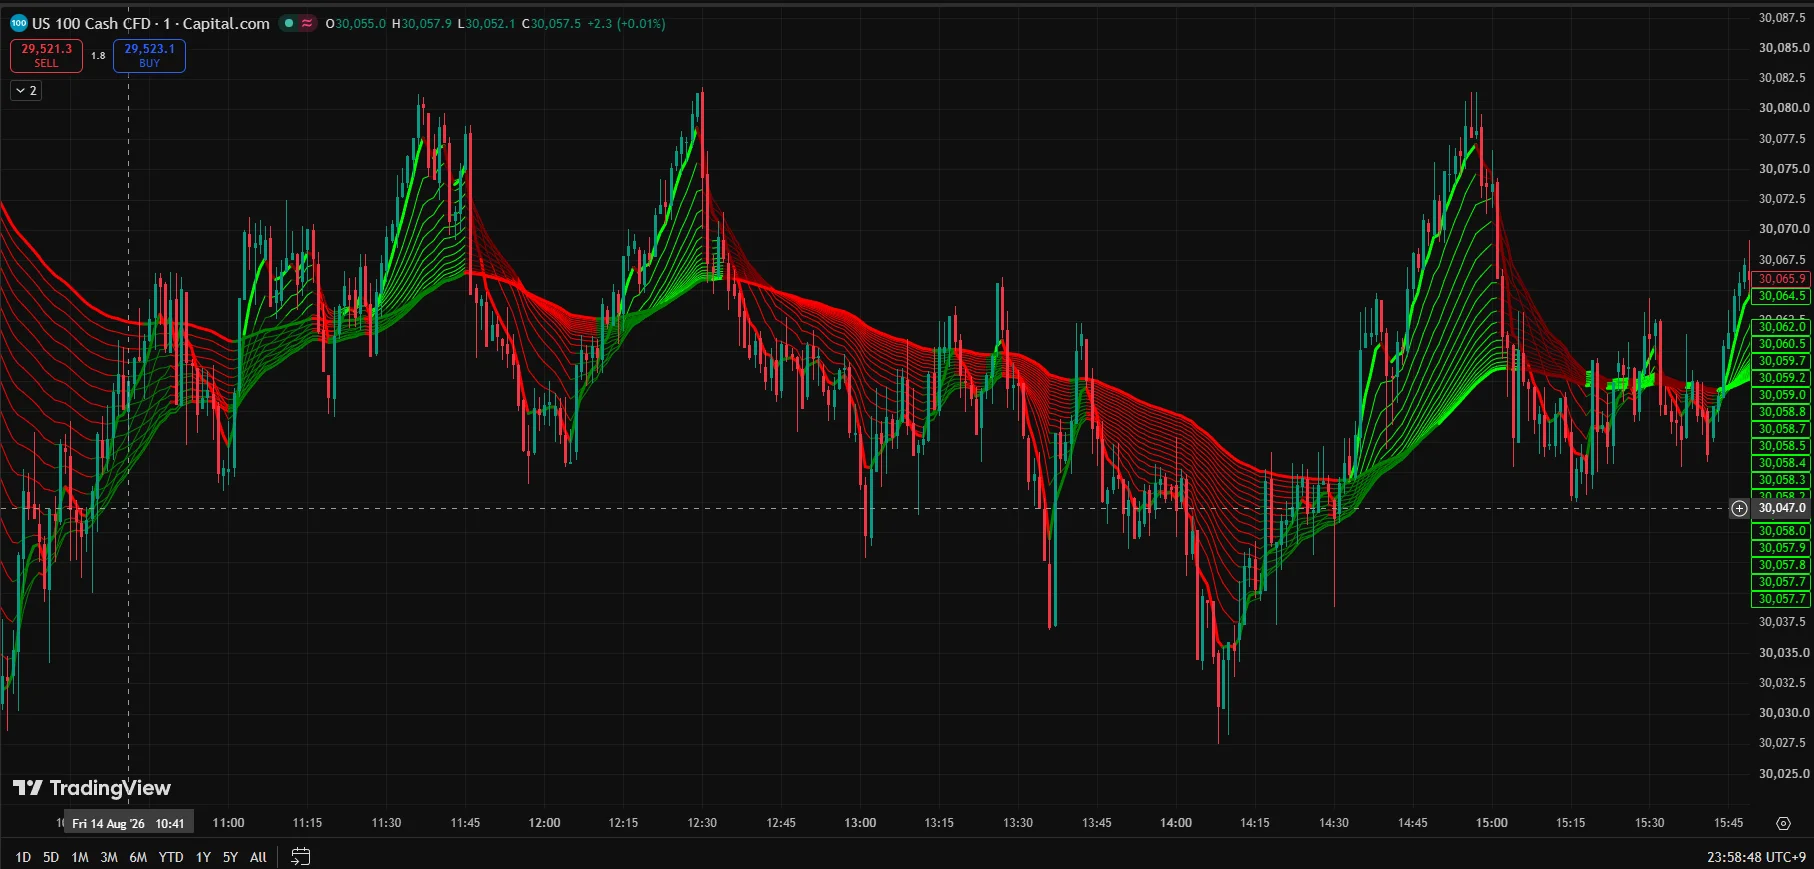
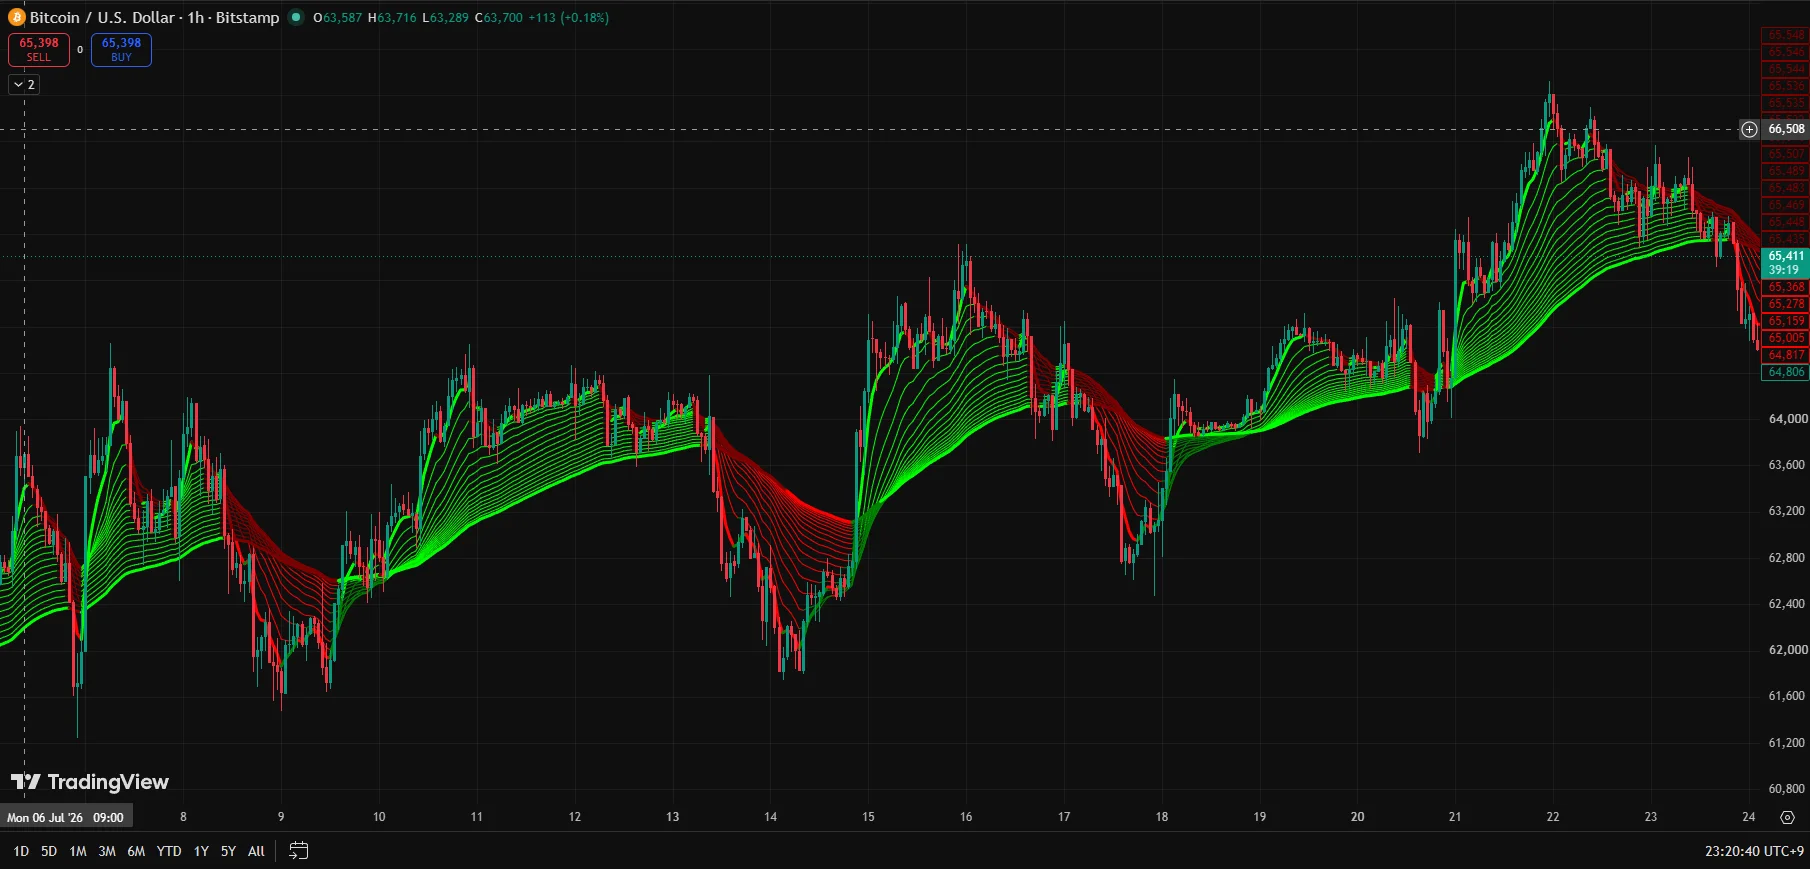
Not just one market, either. Across names with very different characters — Gold, Oil, Nasdaq, Google, Bitcoin — results were relatively stable. The exception was Bitcoin, even on the 1-hour. Direction changes were too frequent to get a stable read.
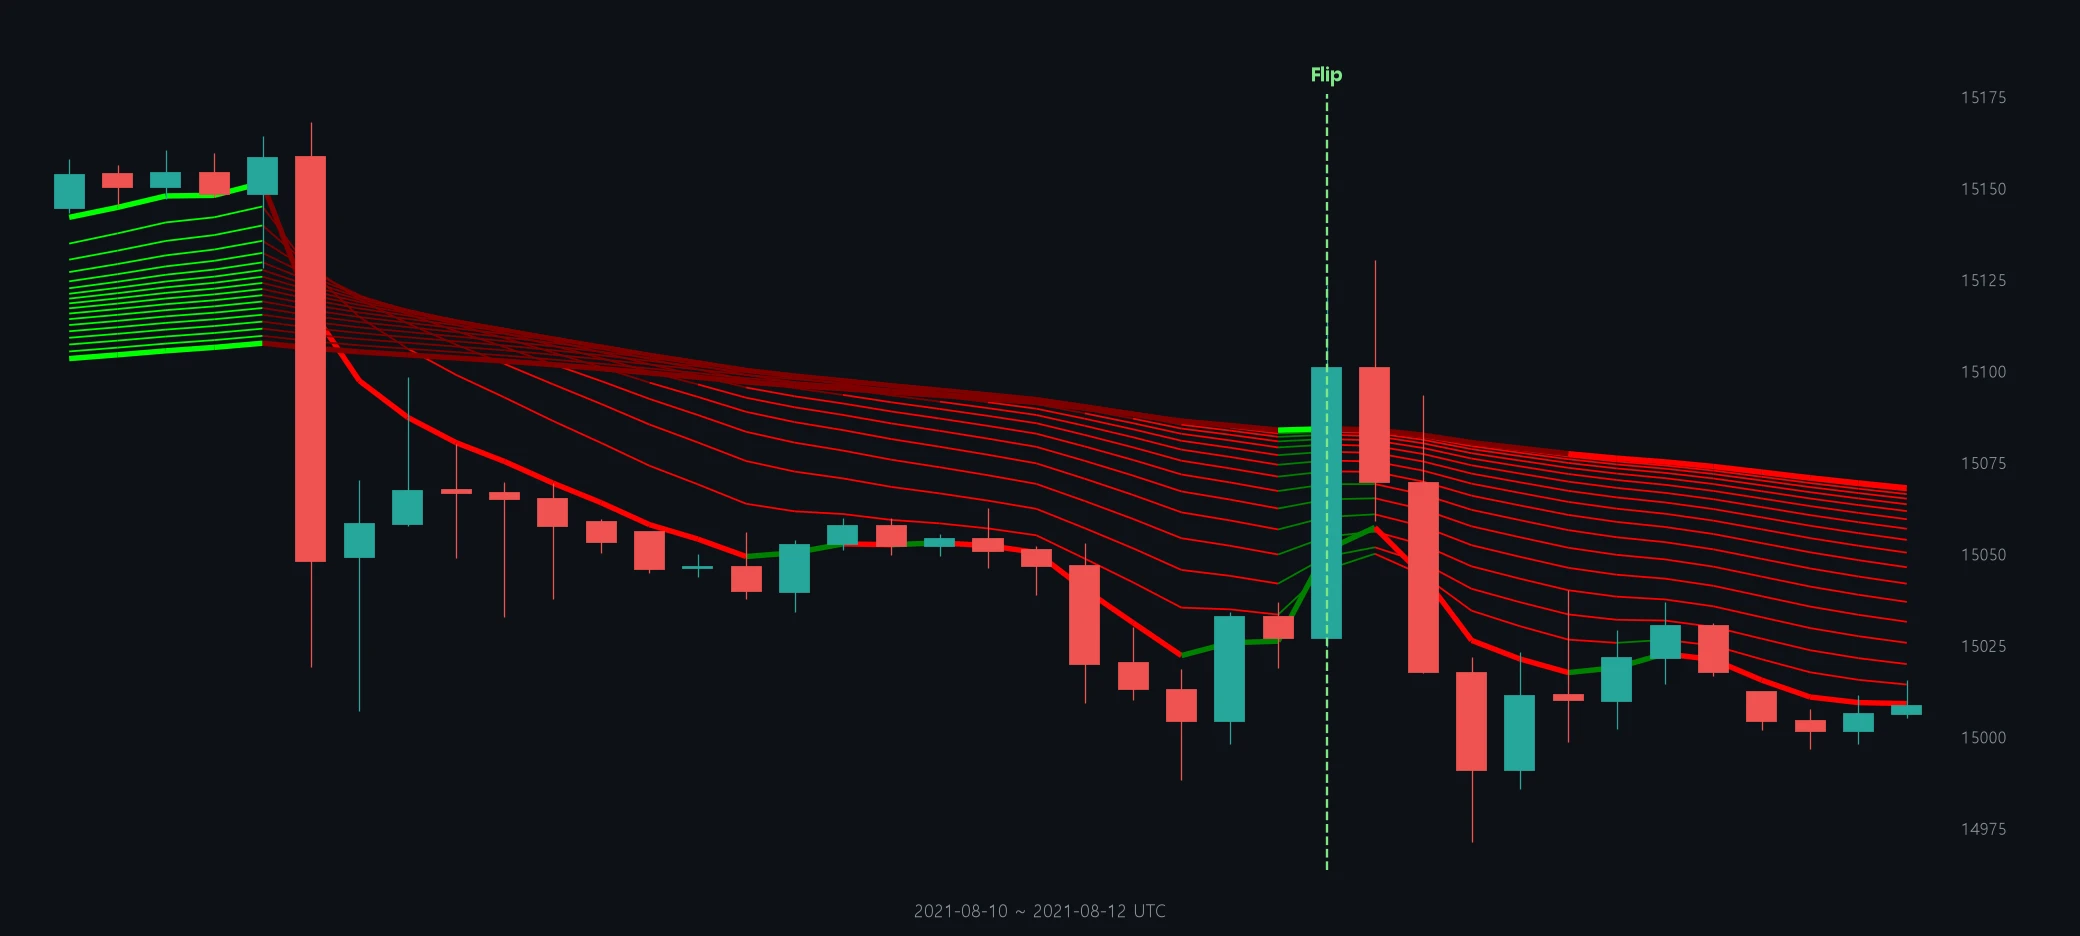
First, the simplest approach: 'buy when it turns green.' All results from this point are based on Nasdaq 1H candles — '4 bars' means 4 hours. The ribbon flipped green on 1,116 occasions. Of those, roughly 43% (475 times) reversed back to red or mixed within 4 bars (4 hours) — false reversals. Enter on the green flip alone, and nearly half your signals are false breakouts.
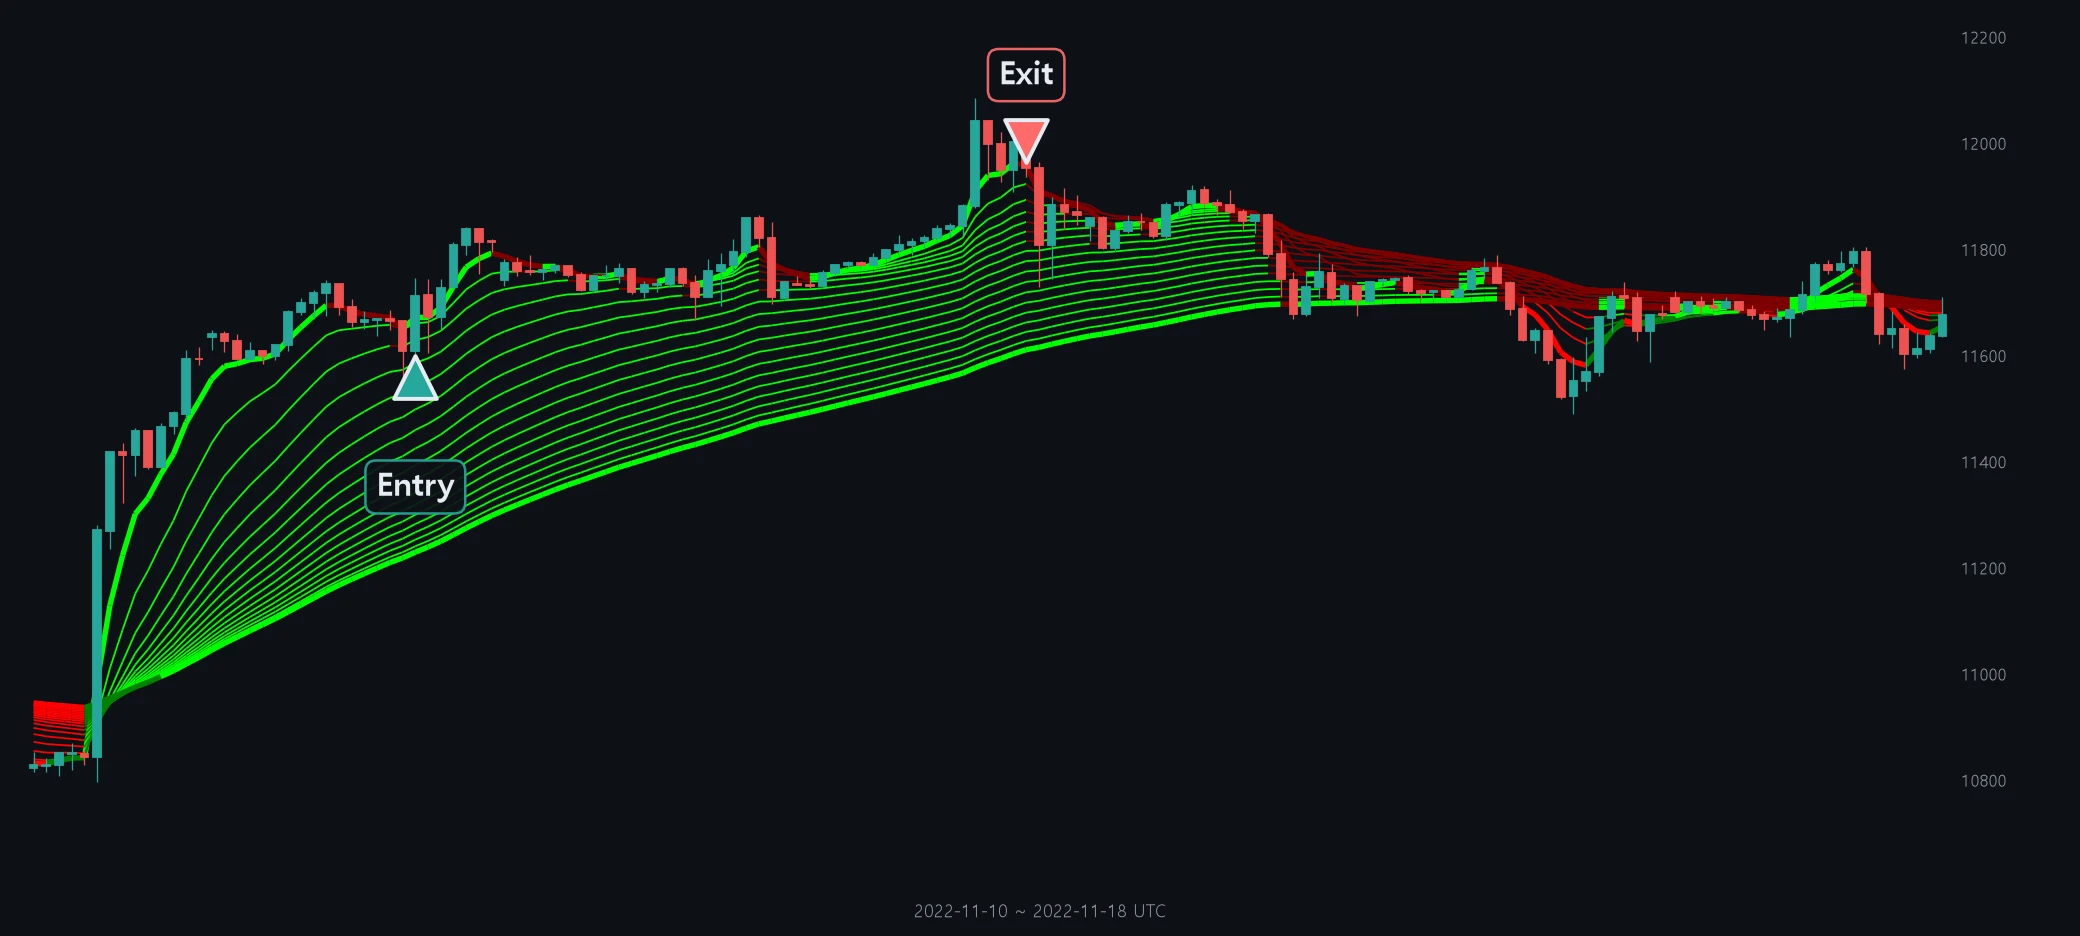
So not buying the moment it turns green. The better entry: while the trend was still alive, wait for price to pull back into the 18-line ribbon — then enter when it reclaims it from above (the pullback entry). That timing produced the most stable results.
In short: this indicator performed well in trends that had clearly broken direction — but struggled when sharp drops and bounces kept reversing it. Exactly what you'd expect from a trend-following tool. That said, these results are based on mechanical entries and stop-losses. Change the leverage, the take-profit, or the stop-loss timing — and the numbers change too.
Continue with research analyzed in-house by TVIEW LAB.
