Not the most powerful indicators.
Ranked by the order you should learn them.
The figures above are observations from historical data and do not guarantee future returns.
Before you read: the three indicators below were not created by TVIEW LAB. So we analyzed each creator's code to infer "Why did they design it this way?" — and combined that with publicly available data to make them easy for first-time readers to understand. This may differ from the creator's actual intent. Use it as reference only.
An indicator that reads market direction visually.
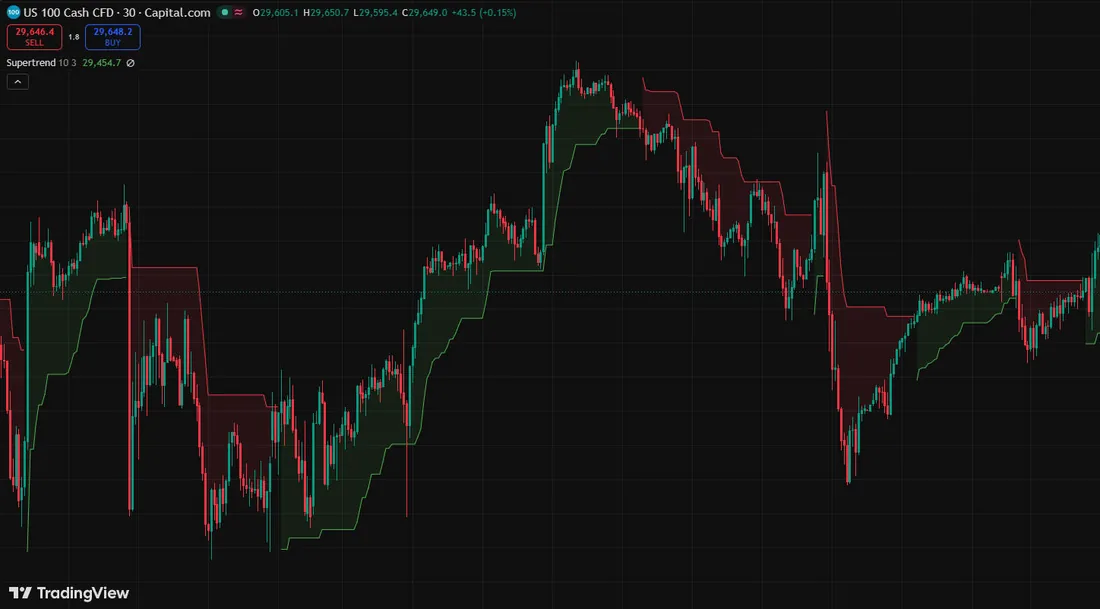
The first sense to build in the market is
Not 'should I buy now?' — but 'which way is the market roughly leaning.'
Actually, no one knows the market direction for certain. That's why 'approximating' is more accurate than 'predicting.' Supertrend condenses the recent price path into one line — if price is above it, the bias leans up; below it, the bias leans down. But it doesn't give a clear entry point, so it's not suited for standalone use.
A line is drawn near price, keeping its distance based on recent price range. It picks a direction — up or down — and changes color when price breaks through that line. The logic is in the same family as moving average golden and death crosses, but presented more visually — easier to read at a glance, less eye strain.
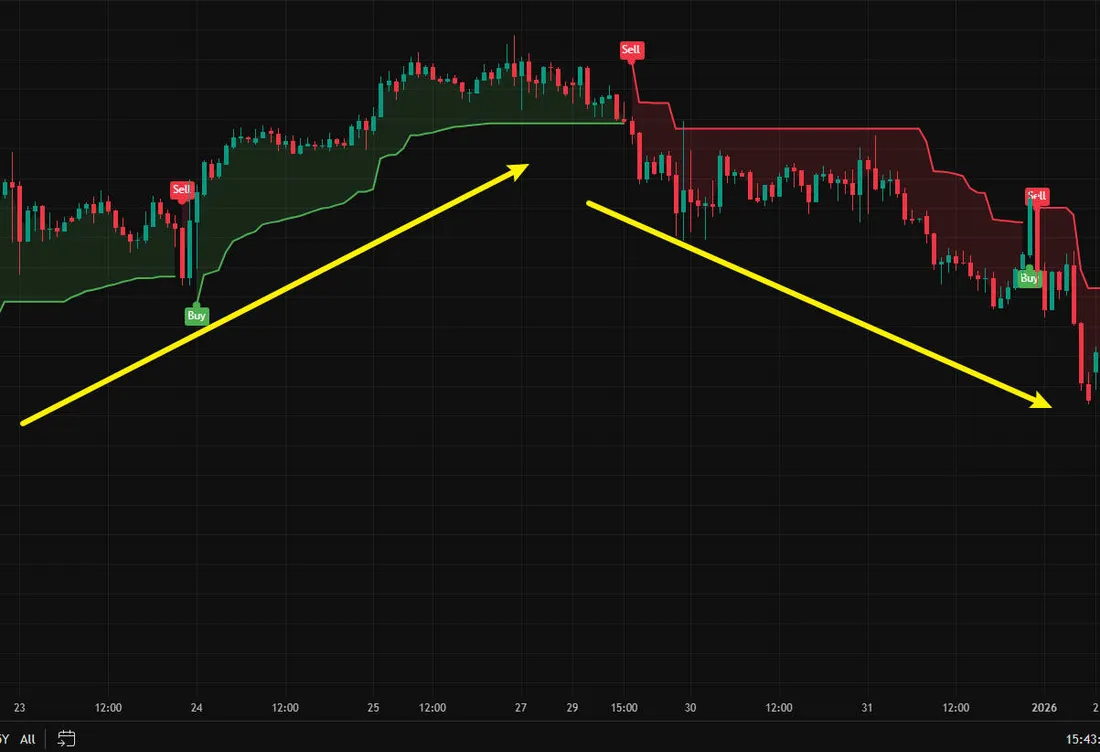
Green means the current bias is up.
Buying pressure is gaining dominance.
Red means the bias is down.
Selling pressure is gaining dominance.
A color change suggests the trend has shifted.
Can be used as an early signal of a trend reversal.
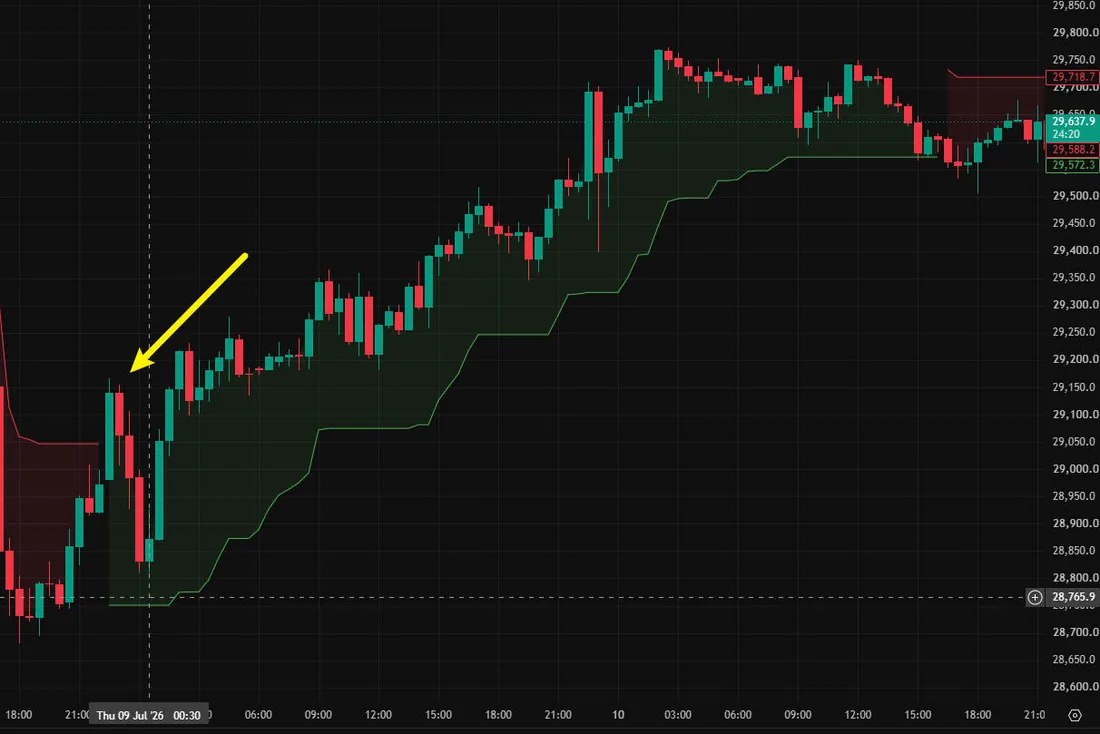
Nasdaq, early morning July 9, 2026. Price bounced hard off the bottom, and around the arrow (near 29,150) the line flipped green. Anyone who entered purely on that color flip would have been caught in the immediate pullback that followed.
That's why instead of entering right on the flip, waiting 3 to 5 more candles and entering when price touches the green support line or a meaningful price defense level gives you a better entry — lower price, less noise. The stronger the move that triggered the flip, the more important this rule becomes.
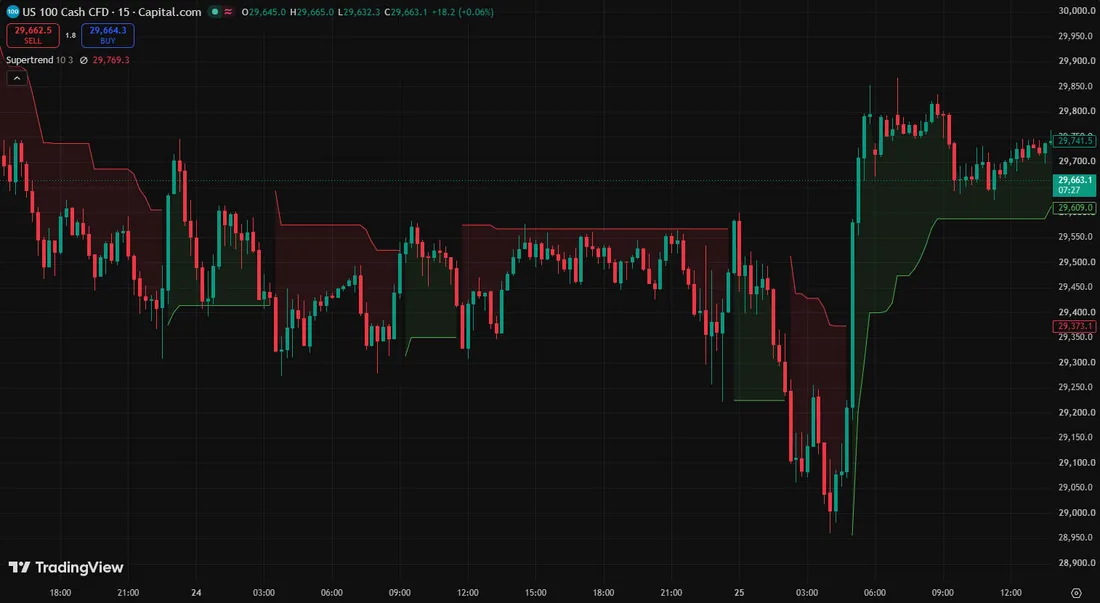
The line is drawn based on how wide prices have been moving recently. When price oscillates within that range, the direction keeps reversing. In those conditions, don't rely on Supertrend alone — reference the #2 indicator alongside it.
You need a rough sense of which direction you're standing in first —
only then can you start layering other indicators on top, one by one — overbought signals, supply zones.
Without directional sense, your reference point wavers — and your judgment wavers with it.
Easy to learn— one line, read by color
You can read the trend intuitively without any complex setup.
Visually clear— just color and line, readable at a glance
Builds the foundation for reading charts quickly and making decisions.
Asset adaptability— works consistently across 7 assets, low market dependency
Shows consistent trend readings across a range of market conditions.
Continue with research analyzed in-house by TVIEW LAB.
